Summary
My course choice for the first semester of the DipGrad programme was to return to Otago Polytechnic and learn a different field within the Information Technology sector. I was put into a pair with someone different from me, and we had to configure four virtual machines using an automation configuration tool and monitor them and their services.
The team assessment, which makes up to 60% of my final grade, was to identify the problem or security breach, list possible solutions, and write up what we have done to resolve it. This paper has taught me how important it is to have documentation, as my partner tends to forget things easily. In the industry, it is vital to restore the problems as soon as possible and how you could restore them.
My tasks and responsibilities
- System monitor: Monitored four machines during the assessment period. I found it very fun to monitor these systems but at the same time stressful because any of them could go down at any time and we have to try and restore it as soon as possible or lose marks. We also had a rostering system so that both of us had a fair share of monitoring the systems during the assessment period.
- Ticketing: For every outage, we have to create tickets of what the problem is and update when progress is made. I found it boring, but we need to keep track of every problem and what we have done. We can also prioritise these tickets to determine what task we should focus on the most.
- Configure and connect four virtual machines: We configured the four machines to connect by giving them hostnames and appended that information using the files in the /etc directory.
- Installing and configuring NTP, MariaDB, and Nagios using Puppet: Configured different machines to install differently. This is handy in case one of the machines is unretrievable and needed to be reinstalled.
- Monitor systems and servers with Nagios and Prometheus: Configured Nagios to monitor the machine status alongside their services, such as the database and Apache2 using Puppet. Configured Prometheus to watch these same systems. We configured alerts for both of these monitoring systems if there was an outage. I liked using Prometheus because we can check how long the history of the service status. Configuring Prometheus to monitor all services was an optional task and we took that challenge to learn.
- Configure ownCloud using Apache2: We installed and ran Apache2 and configured ownCloud to run on the app server.
- Testing and running backups using Rsync: Ran cron jobs for backing up files that needed to be recovered during the team assessment period. We had to backup these files every six hours at different times for each machine so the backup server would not crash.
Outcomes:
- Getting along with someone different from me.
- Restoring systems by listing possible solutions.
- Documentating every failure and how I could restore it.
- Created systemd services for Prometheus.
How I found this course
I found this paper interesting. I was put on a team with a stranger, and later in the semester, I became more comfortable talking with that person. I learned to be confident and do things that may have worried the other team member, but in the end, it worked well.
When the assessment came, I was mostly calm and tried to find possible solutions. I also found Prometheus helpful during the assessment period since it was an optional task for us to do since Nagios can be turned off anytime by the lecturer.
Machines
| Machine | Description |
|---|---|
| mgmt | Where all the management files and Puppet modules are kept. Also hosts the Nagios monitoring system. |
| app | Where ownCloud is hosted on. |
| db | The database server on which the ownCloud web service is hosted. |
| backup | Where Prometheus and Grafana monitoring systems are hosted on. |
| rbackup | Where the backup files for all machines are kept. |
What we could have done differently next time
- Read through the error messages carefully: What we did in the early weeks of configuring Puppet was skipping through the error messages; it turns out that those error messages helped us find the problem.
- Setting the file permissions for newly created files: When we configured Puppet, it caused Nagios not to work; we found out that after breaking the system, the file permissions were set incorrectly.
- Executing the commands that can break more things: When we executed commands, we caused the system to go down, which caused us stress for a couple of hours and made us struggle. Luckily we had made backups that we could restore. Next time, we need to think about what the commands mean before executing them.
Software used
Linux, Puppet, Apache2, MariaDB, MySQL, MySQL client, Nagios, Prometheus
Screenshots of Prometheus
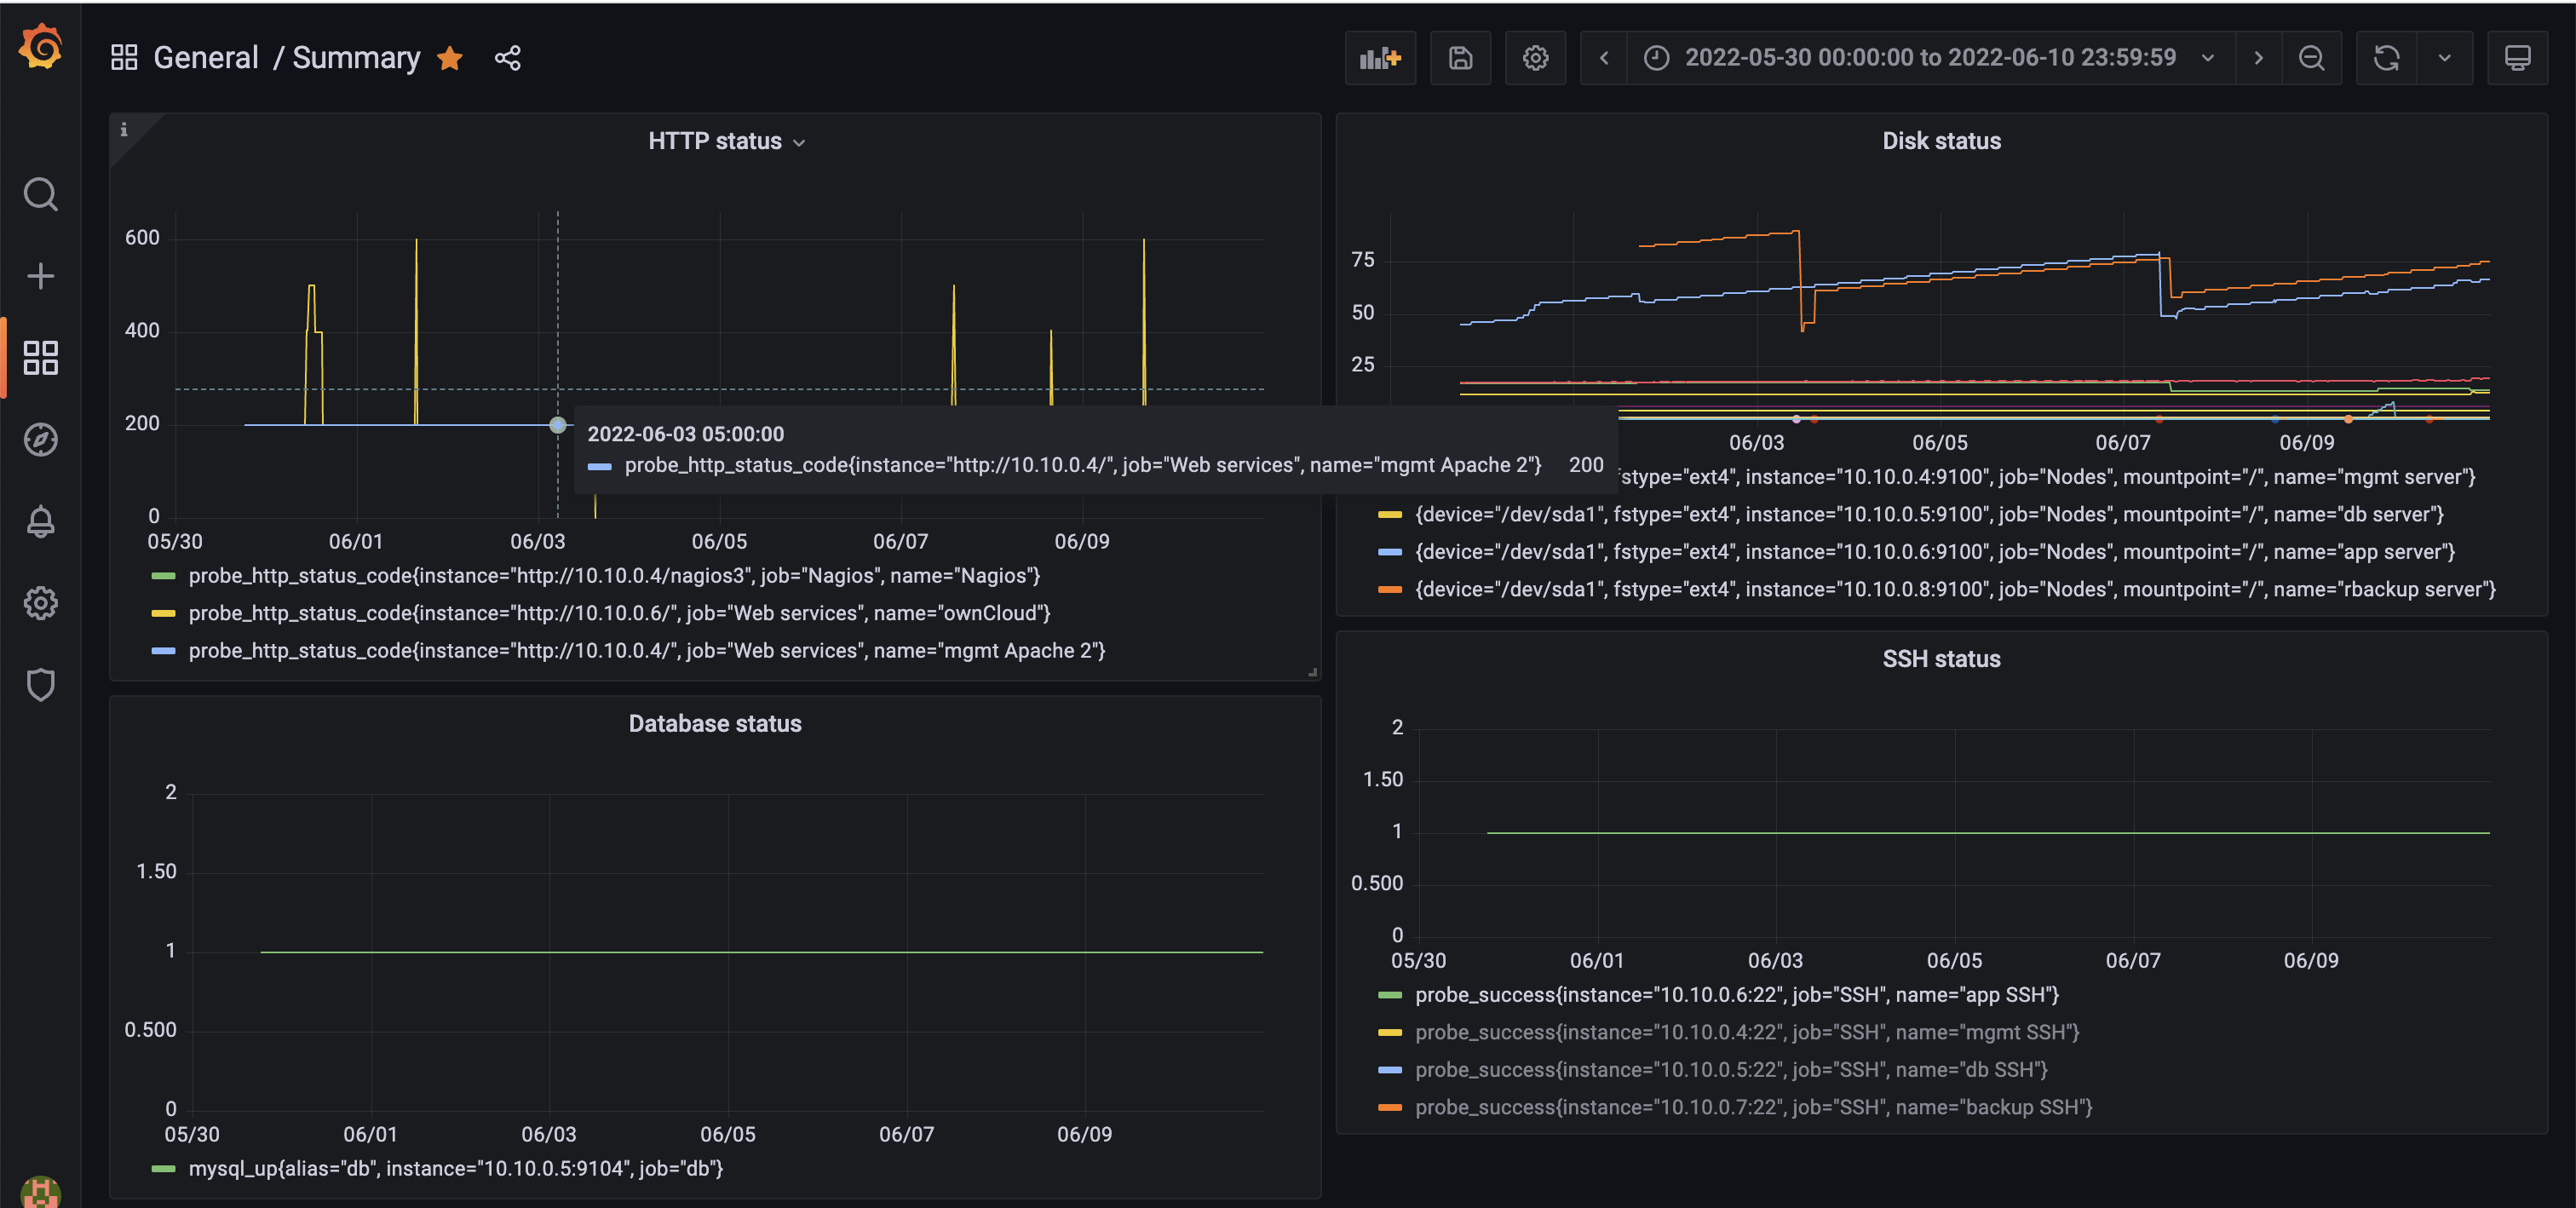
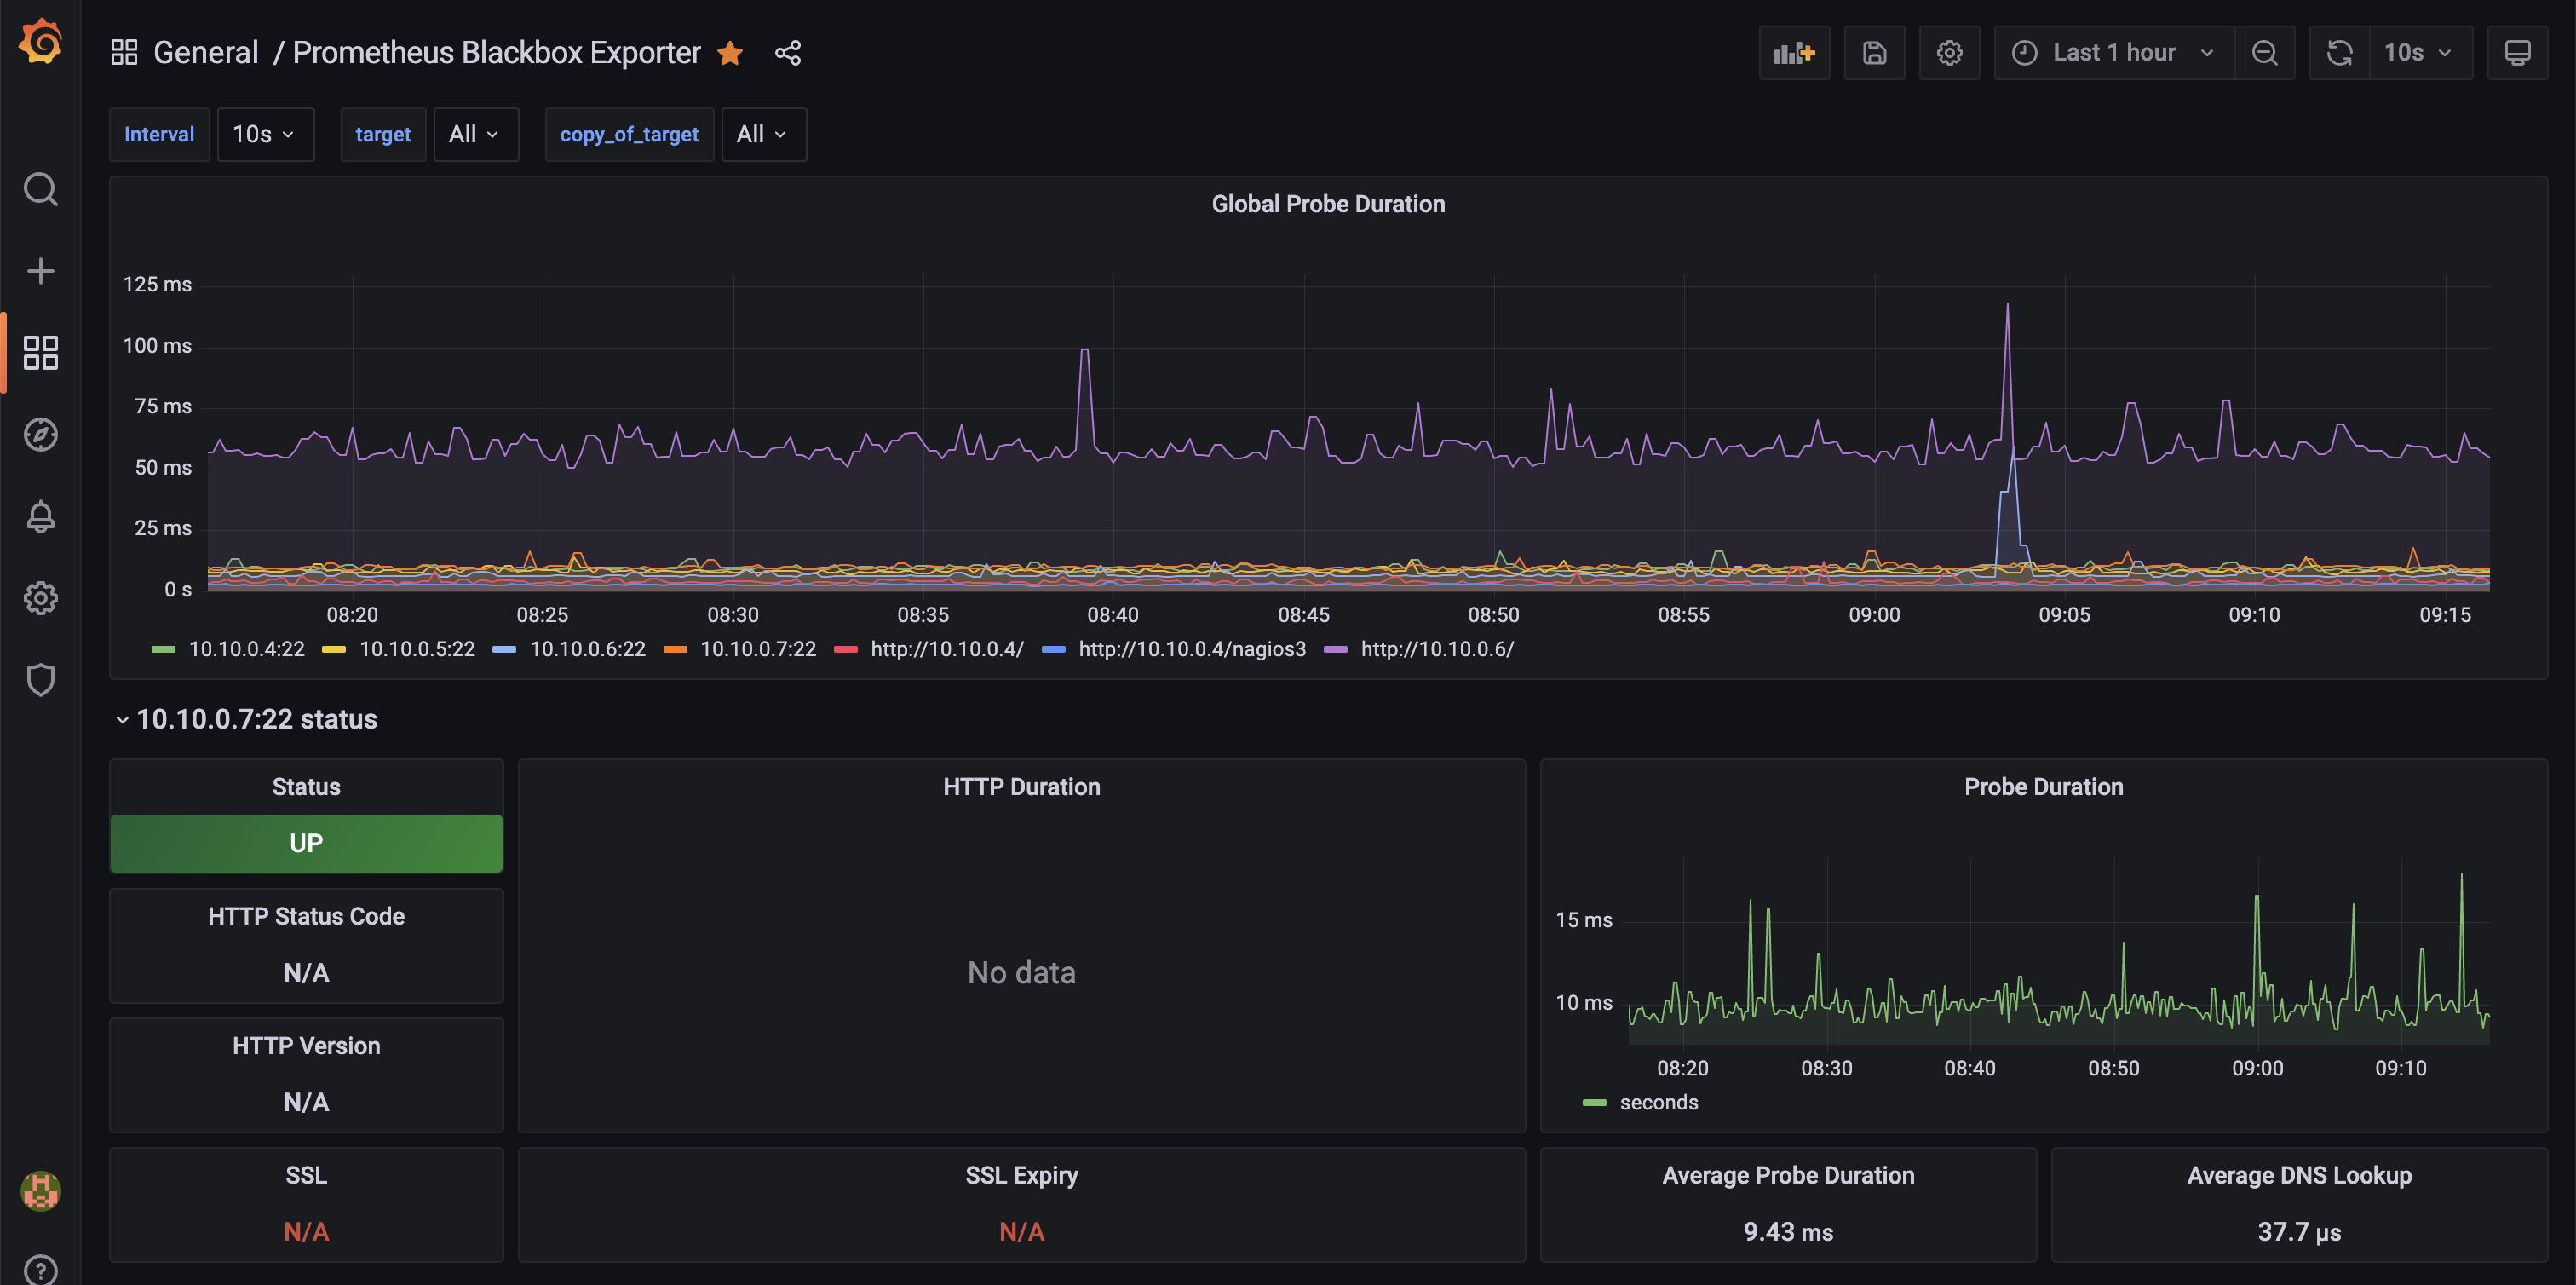
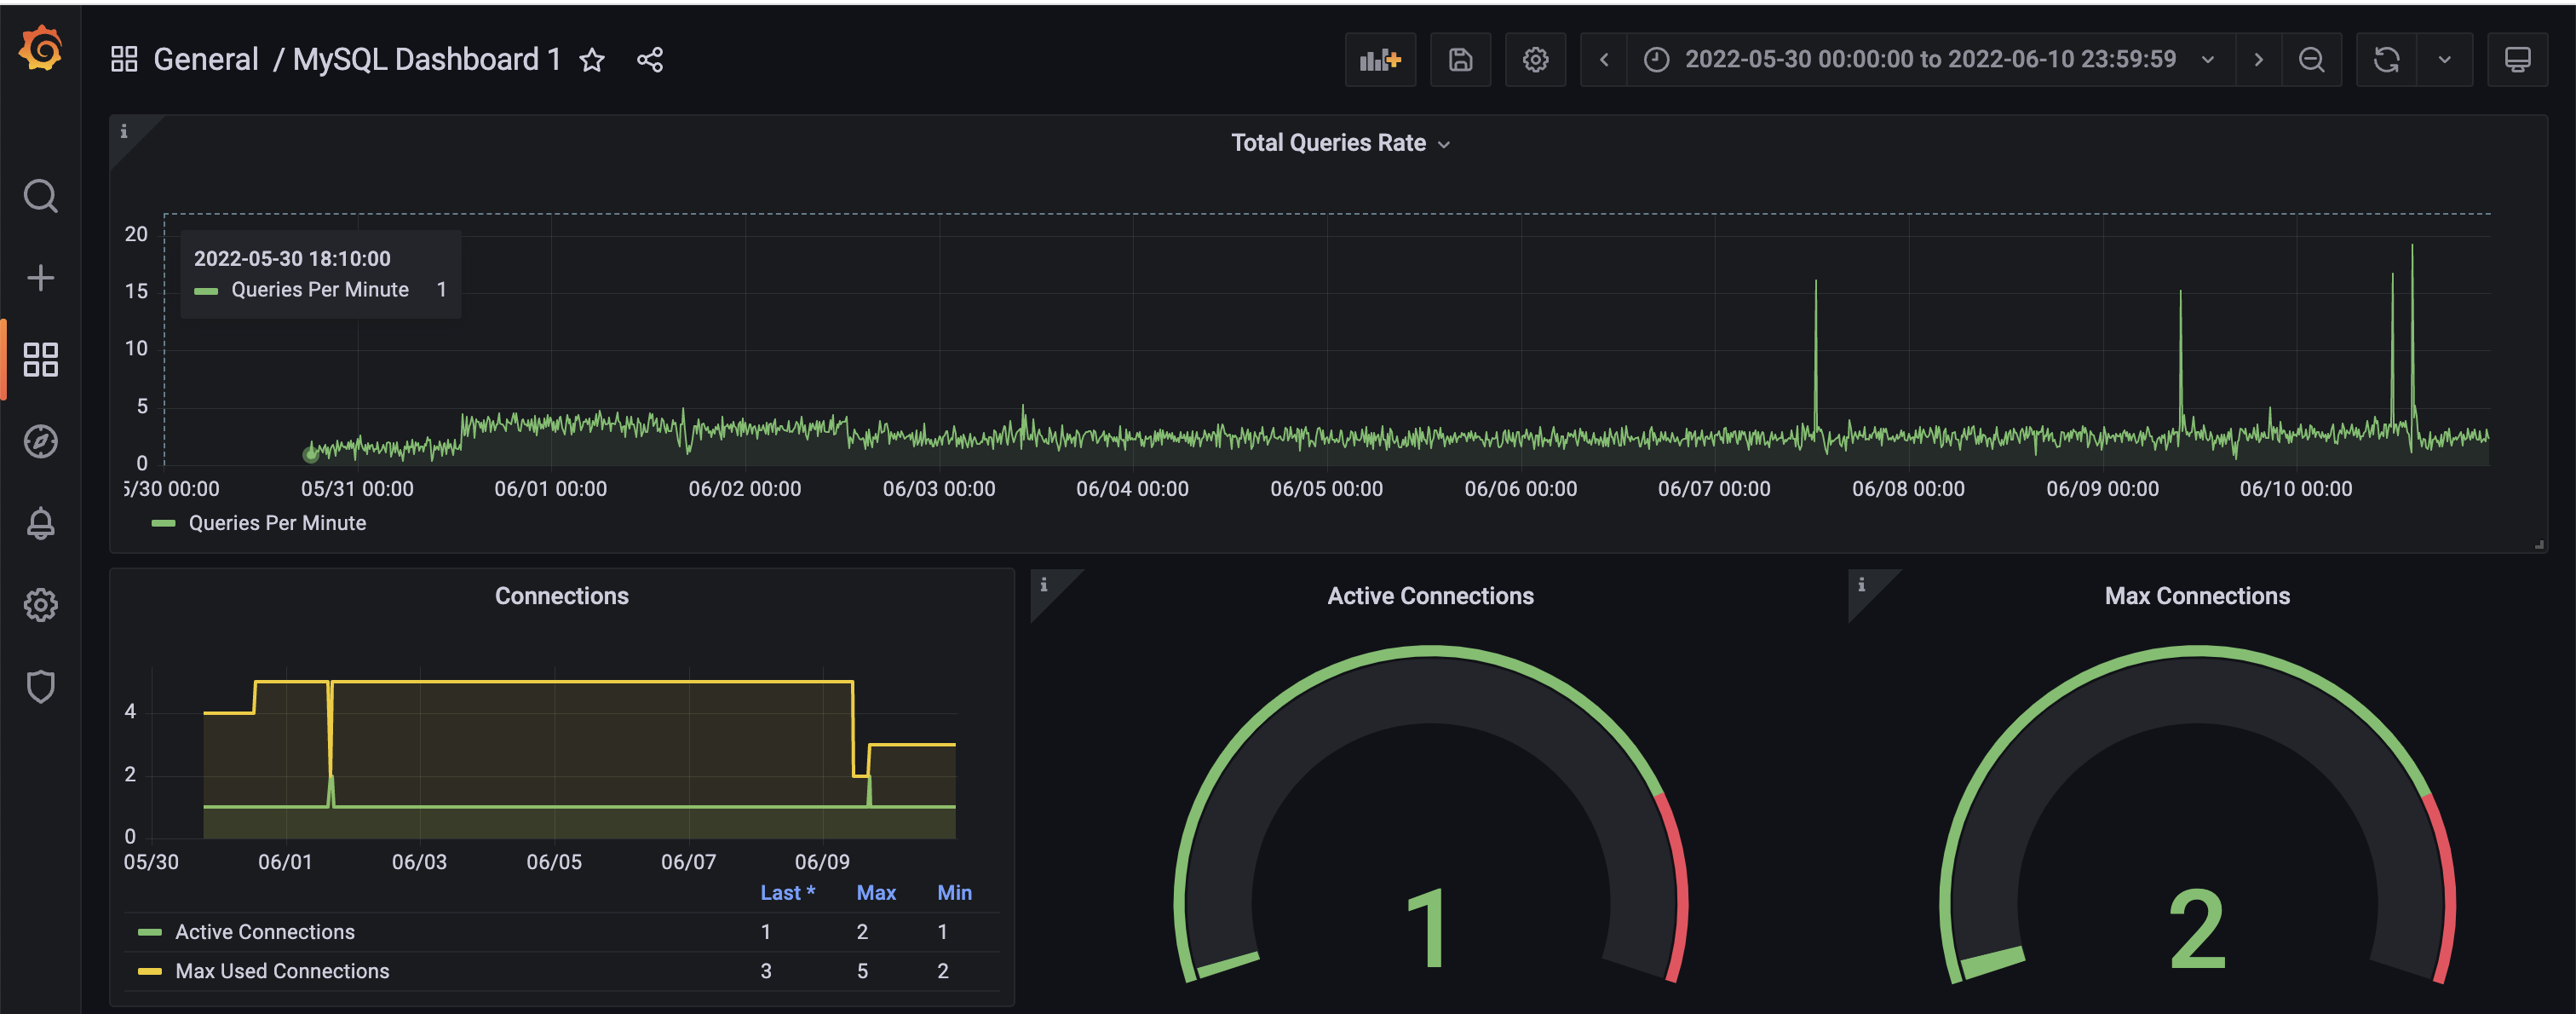
Top-left: Summary
Top-right: ownCloud status (200 is running normal)
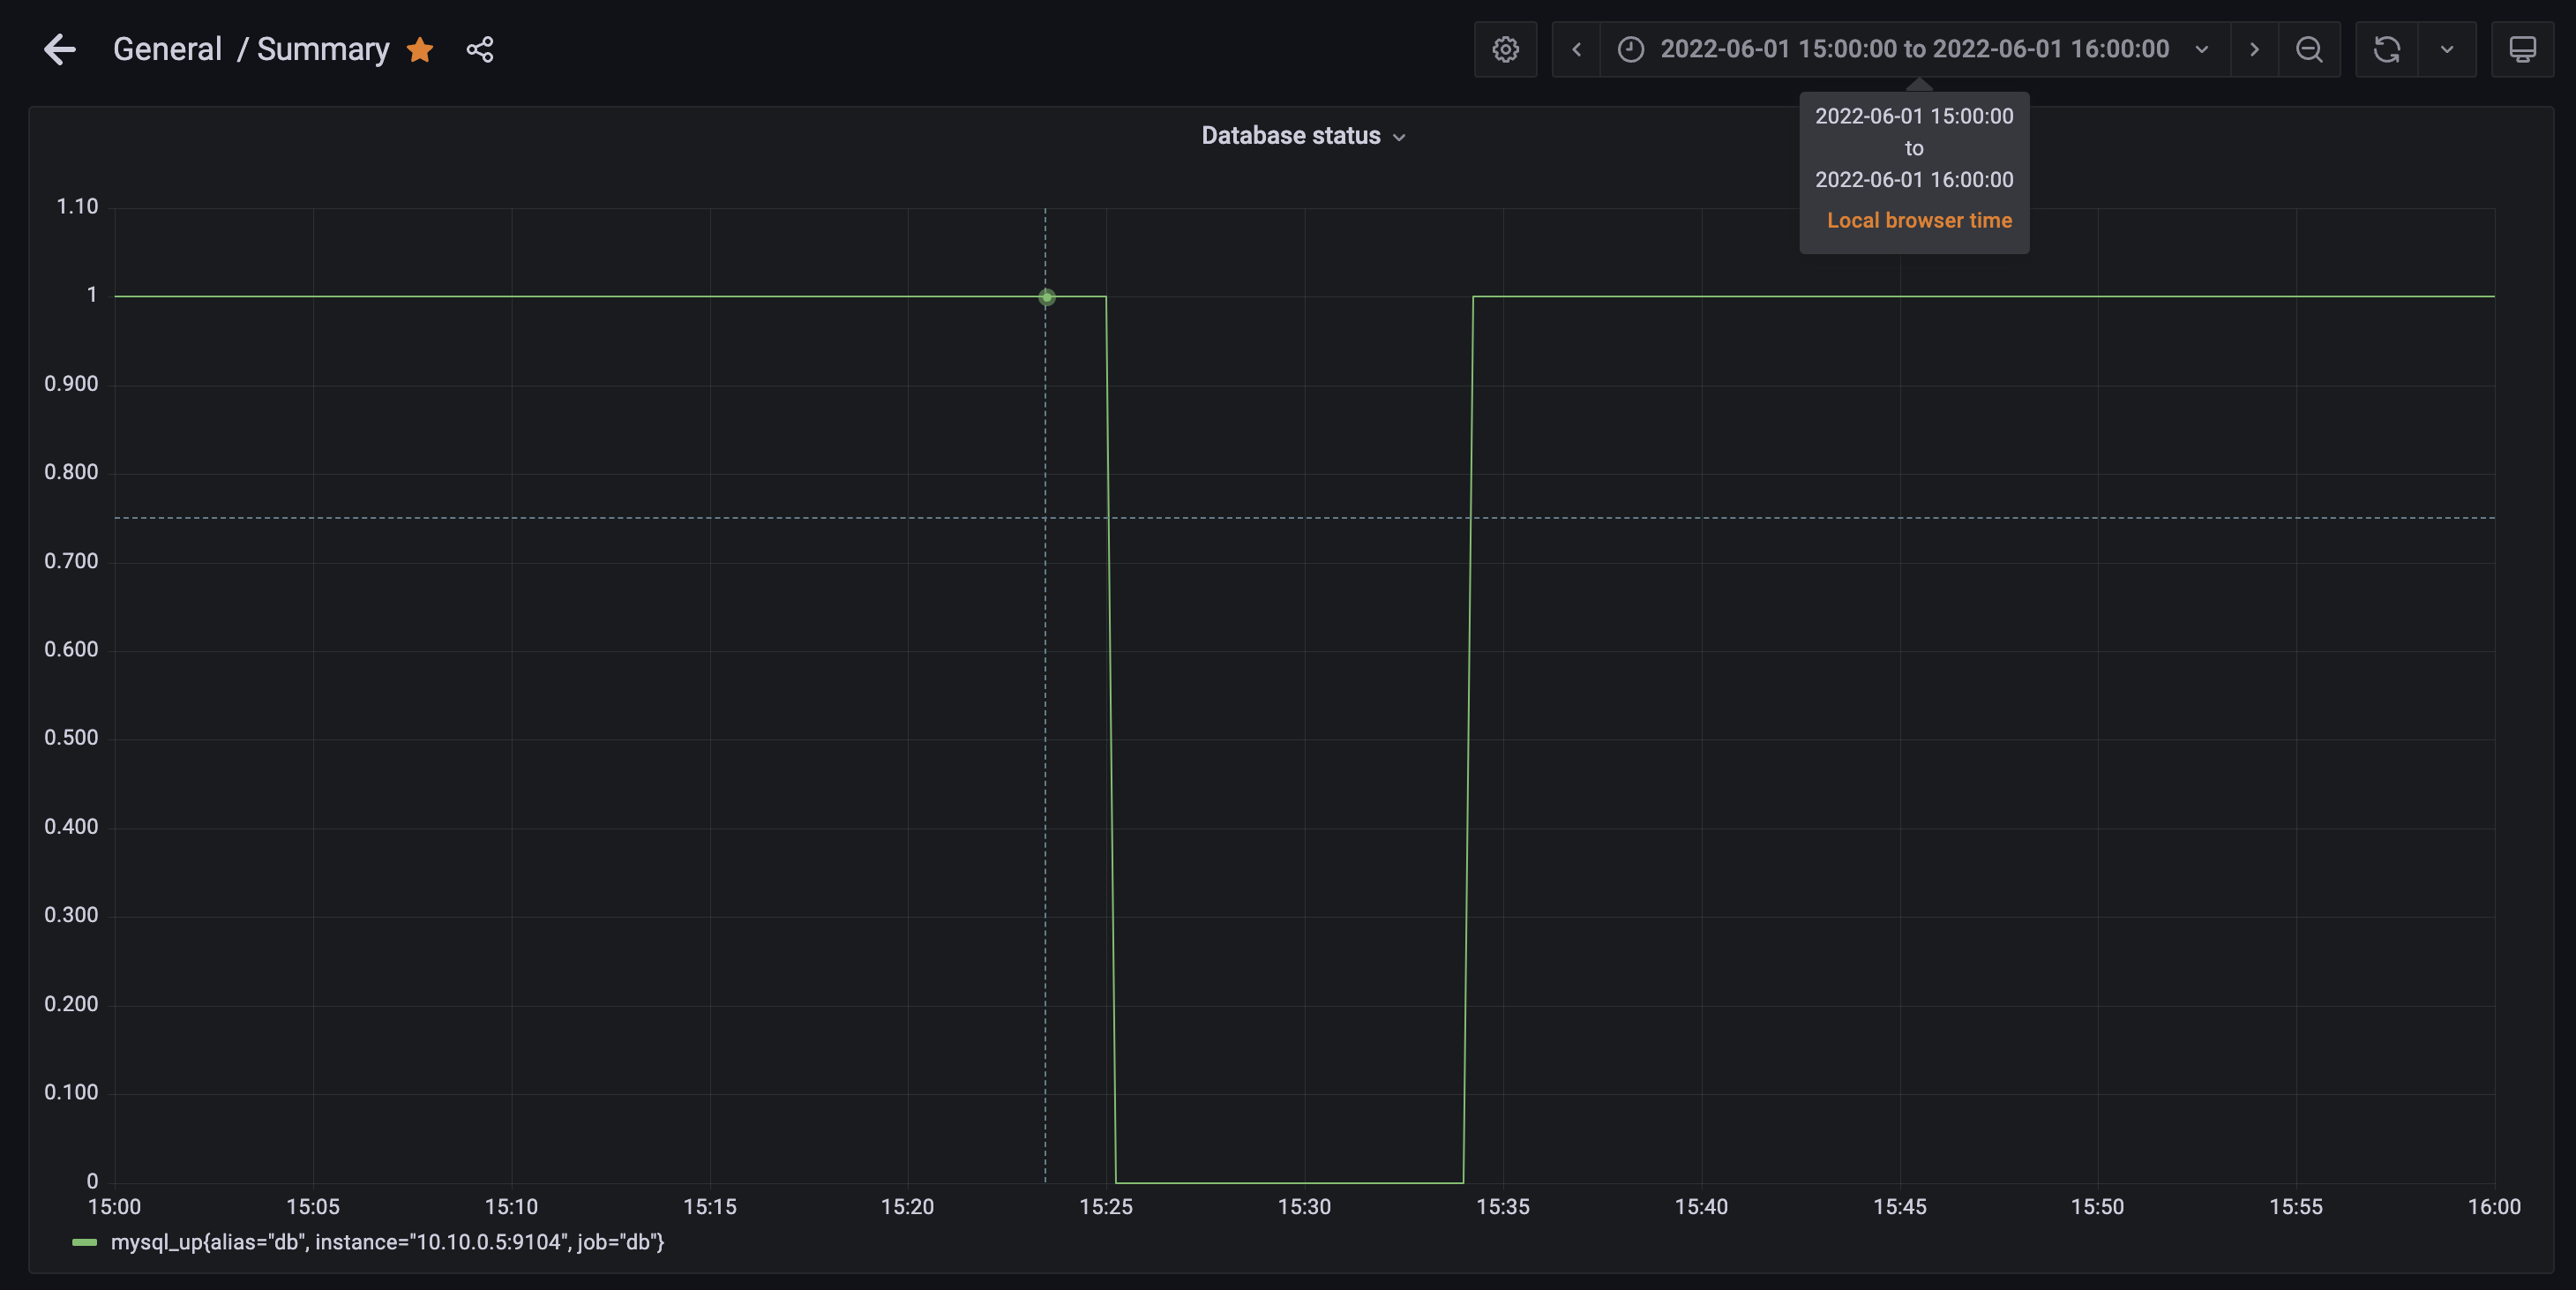
Bottom-left: MySQL status (1 is running normal)
Bottom-right: MySQL dashboard