Client details
David Rozado
Lecturer
Otago Polytechnic
Summary
During my final year of studying at Otago Polytechnic, I put the knowledge over the first two years into a year-long project. My client was a lecturer at Polytechnic; he wanted to have a visualisation graph of a specific word frequently used on an American news website since 1970 and was thrilled with what I did for him. My role was creating the website for the client.
It also included other functions such as finding the top words by year, the odd one out and returning a TSNE graph of how close the words are (such as Trump).
About
- Used data scraped CSV files from an American news website over the past thirty years.
- Manipulated the datasets into a database.
- Can search for articles that are in the database.
- Users can search and returns a list of news articles containing specific words.
- Trained data into word vector models using natural language processing.
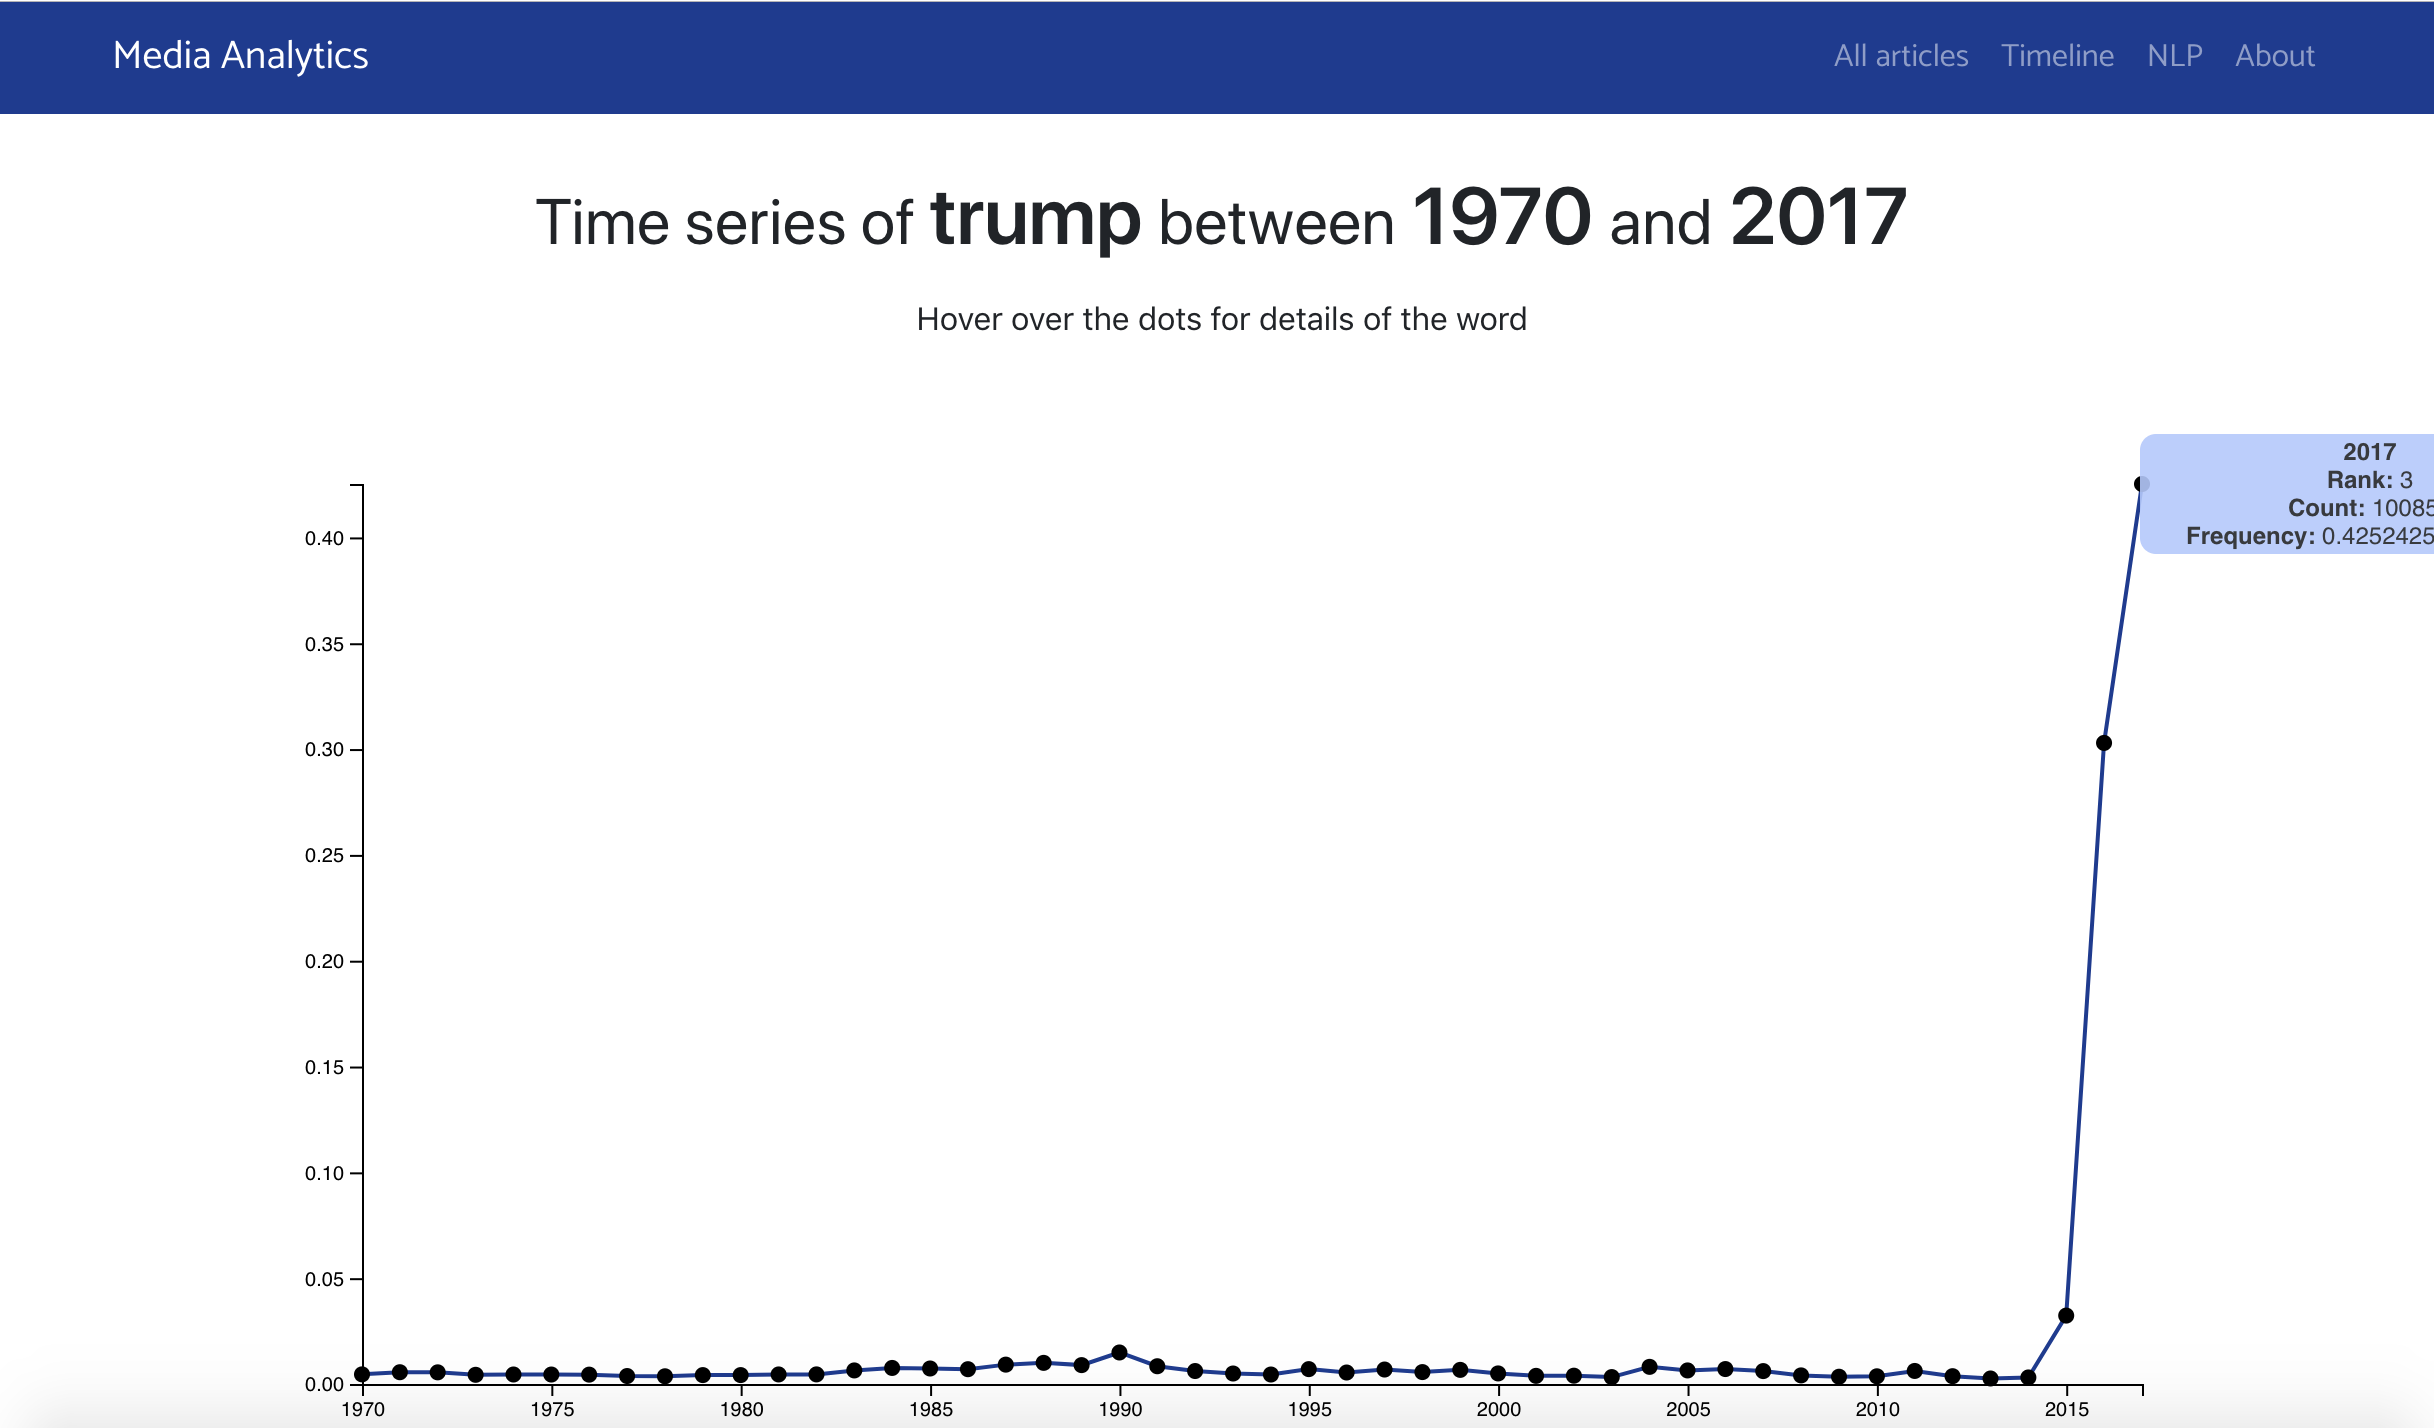
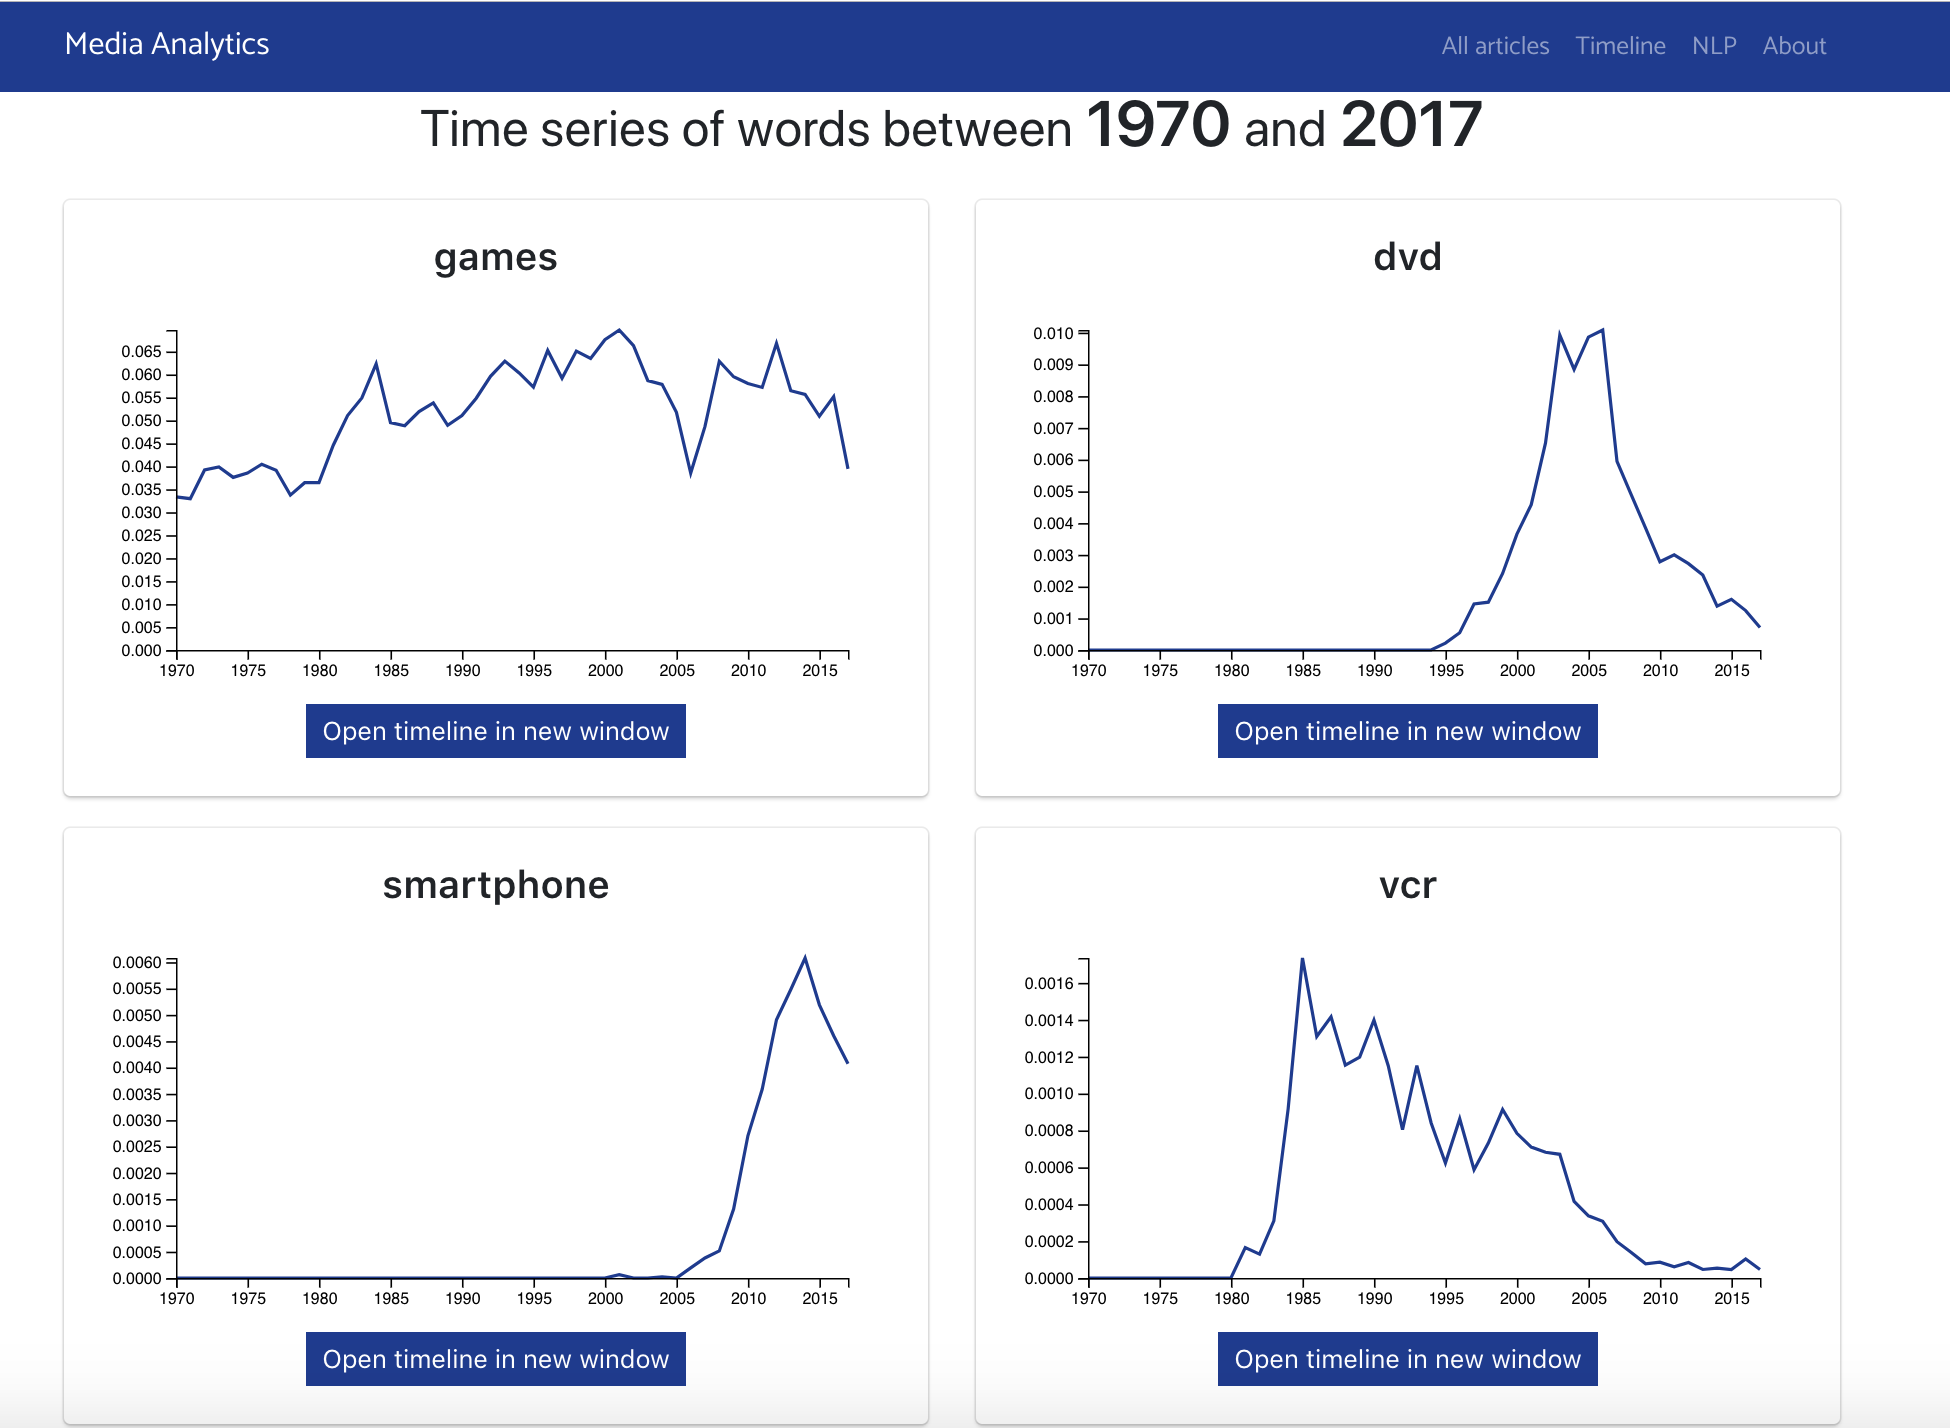
- Display a d3.js line graph of how frequently the word is used over time.
- Find which words are the odd one out and returns it.
- Find the similarity between two words and the frequency of use.
- Display a TSNE graph of time of how close the words are.
- Used Django as a web framework.
- Created a REST API for connecting the se
- Used Python packages scikit-learn and gensim.

My tasks
- Website developer: I had to create the website and implement the features I had while studying. I had to look at a similar code from the client’s past projects and try to implement it into my code. If you take the time at what it does and how the code represents it, it will be easy to get working on your side.
- Data visualisation: This was done using D3.js. I had to research the best simple line graph for the viewer. I took the elements from one of the papers and adjusted them for this project. I also found a way to combine elements from other graphs (such as when a user hovers over the dot to show details of the word).
How I found this project
I initially found this very hard since I was put in a team of two, and one of us would have to look after the website by myself, but after learning how to use web frameworks in the first semester of that year, I found it very easy. I found the data analysis part very interesting, which led me to take a paper about data science years later. I learned the agile purposes of the software development cycle by focusing on planning, trying to find the task out there and having to test it to see if it was working.
I also had fun trying out the timeline of how frequently words have been used, primarily when a major news site had extensively written articles about former President Donald Trump since 2015.
What I could have done next time
- Made the site look good: I used a simple template from Bootstrap. Looking back at it now, it does not look appealing to the viewer. What I could have done was to find what templates would appeal to the audience and make sure it is modern for the next decade.
- Split the API service from the website: When running the website after I make changes, it opens up every single model, which takes up to 10GB of RAM after loading all models, which usually takes about 5-10 minutes. What I should have done during this project was that once the API was completed, I should have split the API and the website.
Outcomes:
- Implementing code from another website that the client had made.
- Communicated with the client efficiently and following the Agile methodlogy.
Screenshots


Software used
JavaScript, CSS, HTML, Bootstrap, Sass, d3.js, Python, MySQL, SQL Server
Python packages
scikit-learn, genism, matplotlib, Django
Repository
Columbia Journalism Review
The project result was published in a Columbia Journalism Review (CJR) article, explaining how extensively the newspaper company covered the then-President of the United States more than any other president in history.